When Everyone Uses AI for Financial Analysis, What Is an Agent's Real Moat?
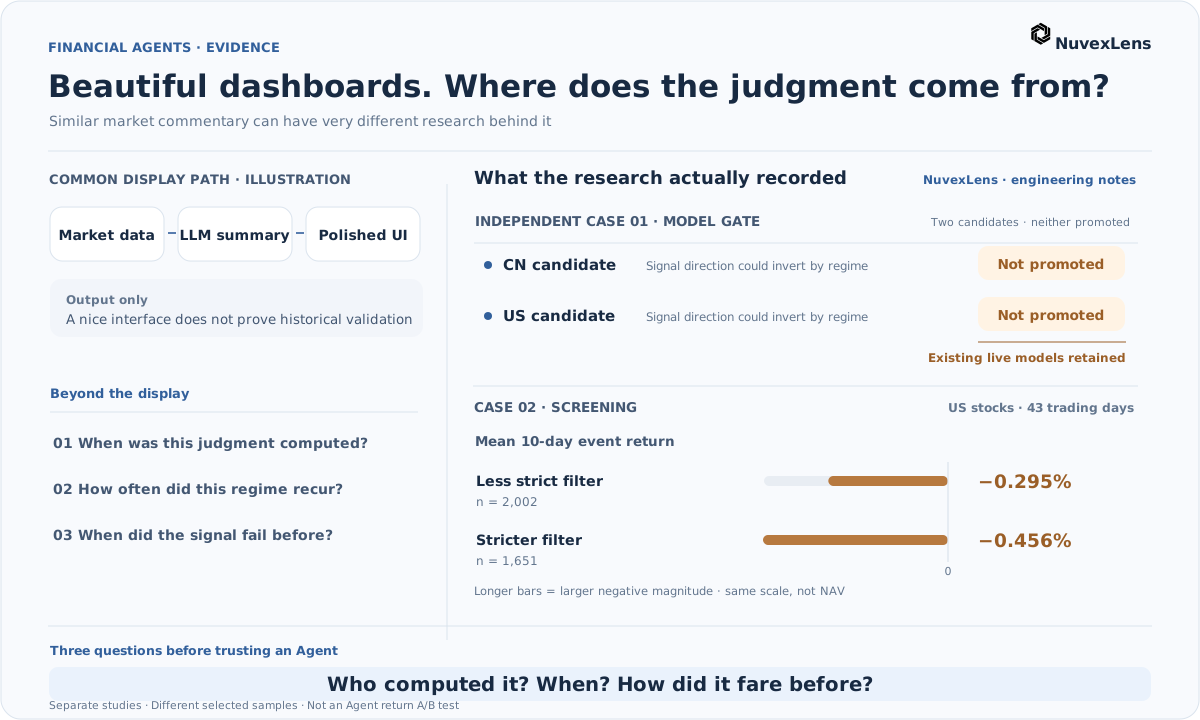
Lately, my social feeds seem full of cyberpunk-looking financial Agents: neon on black, twitching candlestick charts, polished dashboards. A few lines of Vibe Coding can produce a convincing interface. After a while, some of them start to feel as if they came off the same assembly line. Connect commodity market data, ask an LLM to narrate what is happening, and play it back through a different UI.
Live prices, technical indicators, and order-flow analysis all have legitimate uses. But switch off the animation and listen to another quick “bullish” or “bearish” summary. Where is the research behind that judgment?
Anyone can buy market data or rent an LLM. In a market full of sophisticated competitors, whose research judgment does your Agent actually bring to the table? Why would a beautiful report give you an edge? Are the prompts you send the LLM really your core moat?
Revisiting my NuvexLens development notes, I found two unflattering results more worth discussing than any polished demo.
The Model Finished Running. The Candidate Still Didn’t Ship.
During an October production acceptance check, both the China and US automated optimization jobs ran to completion and produced candidate models. Both triggered a signal-direction reversal guard for the relevant market regime. In plain language, the system identified a risk that the signal’s statistical relationship had flipped under that market condition. It refused to replace the existing weights. This wasn’t simply a forecast of the index rising or falling that turned out wrong.
A job completing and a model qualifying for production are two separate checks. The candidates remained candidates; the existing live models stayed in place.
For an investment-research tool, I want historical data and research models that have been worked on over time. When a similar market pattern comes along, I want to know how often it occurred before, how subsequent outcomes were distributed, and in which regimes the signals failed. History won’t repeat on command, and a model can still be wrong. Those records come from actual calculations, validation, and corrections. A better prompt can’t manufacture them on the spot.
Tighter Filtering, Worse Results at Ten Days
A separate US historical threshold study covered 43 trading days. The stricter filter made some three- and five-day statistics look better, but the mean ten-day event return moved from −0.295% to −0.456%. The two filters selected 2,002 and 1,651 deduplicated ten-day event records respectively.
These are price changes over the ten days following a signal, not realized losses in a trading account. Changing the filter also changes which observations are included; deduplicating records doesn’t make overlapping ten-day holding windows independent. Declaring “stricter is better” from the shorter horizons would be premature.
Another trap surfaced when I checked the return calculations. A holding-period event return grouped by signal date cannot simply be treated as the daily net asset value of an actual portfolio. Calculate Sharpe or drawdown from that series as though it were a trading equity curve, and the report may look sophisticated while describing the wrong object.
Those awkward records are what I want an Agent to carry into its answers: which candidates were rejected, where short-horizon improvements failed to survive longer scrutiny, and which metrics need a different accounting basis. Public data and careful research code can build this kind of evidence too. For a hands-on example, I tested factor Rank IC and bucket returns over multiple horizons using public ETFs.
Let the Agent Explain. Don’t Ask It to Invent the Research.
I also used Muse, Meta’s personal Agent, to read an earlier NuvexLens research snapshot through an authorized REST endpoint. That was a separate integration check. We have not matched its individual published results to the two historical cases above. An interface can deliver research that was already produced; the research work happens before the question is asked.
Being able to draw a chart doesn’t mean a prediction will pay off. I keep coming back to three questions: Who calculated this? When was it calculated? How did similar judgments fare in the past? If an Agent can’t answer, its eloquence hasn’t answered the moat question either.
Note: These are historical research and engineering observations, not a like-for-like return comparison between a generic financial Agent and a proprietary model. This article is not investment advice.